bezier.curved_polygon module
Curved polygon and associated helpers.
A curved polygon (in \(\mathbf{R}^2\)) is defined by the collection of Bézier curves that determine the boundary.
-
class
bezier.curved_polygon.CurvedPolygon(*edges)¶ Bases:
objectRepresents an object defined by its curved boundary.
The boundary is a piecewise defined collection of Bézier curves.
Note
The direction of the nodes in each
Curveon the boundary is important: we check that one curve begins where the last one ended.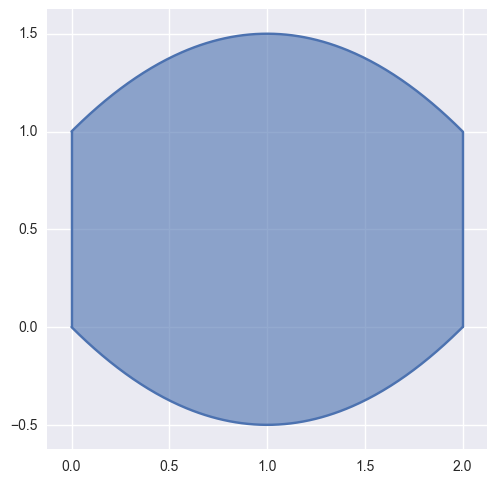
>>> import bezier
>>> edge0 = bezier.Curve(np.array([
...     [0.0,  0.0],
...     [1.0, -1.0],
...     [2.0,  0.0],
... ]))
>>> edge1 = bezier.Curve(np.array([
...     [2.0, 0.0],
...     [2.0, 1.0],
... ]))
>>> edge2 = bezier.Curve(np.array([
...     [2.0, 1.0],
...     [1.0, 2.0],
...     [0.0, 1.0],
... ]))
>>> edge3 = bezier.Curve(np.array([
...     [0.0, 1.0],
...     [0.0, 0.0],
... ]))
>>> curved_poly = bezier.CurvedPolygon(
...     edge0, edge1, edge2, edge3)
>>> curved_poly
<CurvedPolygon (num_sides=4)>
Though the endpoints of edge pair of edges are verified to match, the curved polygon as a whole is not verified, so creating a curved polygon with self-intersections is possible:
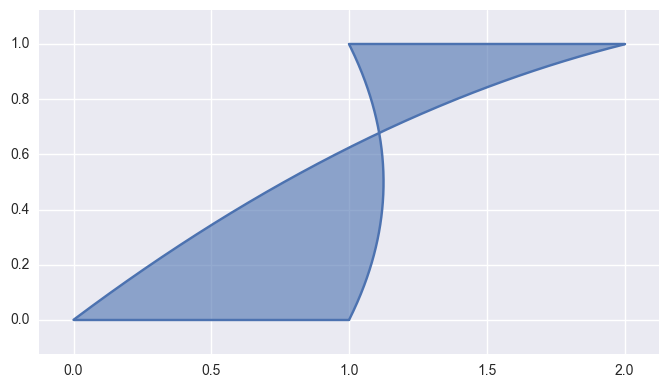
>>> edge0 = bezier.Curve(np.array([
...     [0.0, 0.0],
...     [1.0, 0.0],
... ]))
>>> edge1 = bezier.Curve(np.array([
...     [1.0 , 0.0],
...     [1.25, 0.5],
...     [1.0 , 1.0],
... ]))
>>> edge2 = bezier.Curve(np.array([
...     [1.0, 1.0],
...     [2.0, 1.0],
... ]))
>>> edge3 = bezier.Curve(np.array([
...     [2.0, 1.0 ],
...     [1.0, 0.75],
...     [0.0, 0.0 ],
... ]))
>>> curved_poly = bezier.CurvedPolygon(
...     edge0, edge1, edge2, edge3)
>>> curved_poly
<CurvedPolygon (num_sides=4)>
Parameters: edges ( Tuple[Curve, ... ]) – The boundary edges of the curved polygon.-
num_sides¶ int: The number of sides in the current polygon.
-
plot(pts_per_edge, color=None, ax=None, show=False)¶ Plot the current curved polygon.
Parameters: Returns: The axis containing the plot. This may be a newly created axis.
Return type:
-