bezier
Helper for Bézier Curves, Triangles, and Higher Order Objects


![]()

This library provides:
Dive in and take a look!
Why Bézier?
A Bézier curve (and surface, etc.) is a parametric curve that uses the Bernstein basis:
to define a curve as a linear combination:
This comes from the fact that the weights sum to one:
This can be generalized to higher order by considering three, four, etc. non-negative weights that sum to one (in the above we have the two non-negative weights \(s\) and \(1 - s\)).
Due to their simple form, Bézier curves:
- can easily model geometric objects as parametric curves, surfaces, etc.
- can be computed in an efficient and numerically stable way via de Casteljau’s algorithm
- can utilize convex optimization techniques for many algorithms (such as curve-curve intersection), since curves (and surfaces, etc.) are convex combinations of the basis
Many applications – as well as the history of their development – are described in “The Bernstein polynomial basis: A centennial retrospective”, for example;
Installing
bezier can be installed with pip:
$ python    -m pip install --upgrade bezier
$ python2.7 -m pip install --upgrade bezier
$ python3.6 -m pip install --upgrade bezier
bezier is open-source, so you can alternatively grab the source
code from GitHub and install from source.
Getting Started
For example, to create a curve:
>>> nodes1 = np.asfortranarray([
...     [0.0, 0.5, 1.0],
...     [0.0, 1.0, 0.0],
... ])
>>> curve1 = bezier.Curve(nodes1, degree=2)
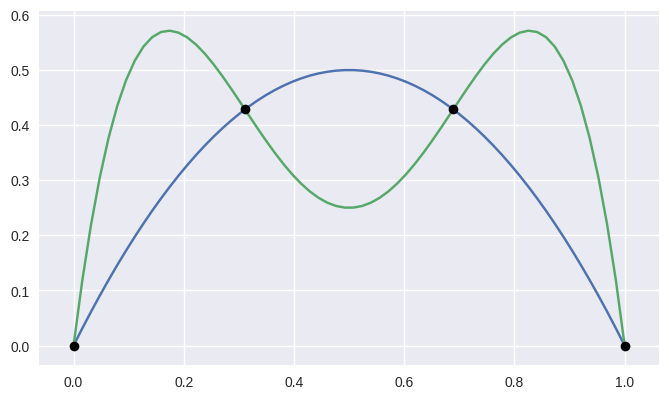
The intersection (points) between two curves can also be determined:
>>> nodes2 = np.asfortranarray([
...     [0.0, 0.25,  0.5, 0.75, 1.0],
...     [0.0, 2.0 , -2.0, 2.0 , 0.0],
... ])
>>> curve2 = bezier.Curve.from_nodes(nodes2)
>>> intersections = curve1.intersect(curve2)
>>> intersections
array([[0.31101776, 0.68898224, 0. , 1. ],
       [0.31101776, 0.68898224, 0. , 1. ]])
>>> s_vals = np.asfortranarray(intersections[0, :])
>>> points = curve1.evaluate_multi(s_vals)
>>> points
array([[0.31101776, 0.68898224, 0. , 1. ],
       [0.42857143, 0.42857143, 0. , 0. ]])
and then we can plot these curves (along with their intersections):
>>> import matplotlib.pyplot as plt
>>> import seaborn
>>> seaborn.set()
>>>
>>> ax = curve1.plot(num_pts=256)
>>> _ = curve2.plot(num_pts=256, ax=ax)
>>> lines = ax.plot(
...     points[0, :], points[1, :],
...     marker='o', linestyle='None', color='black')
>>> _ = ax.axis('scaled')
>>> _ = ax.set_xlim(-0.125, 1.125)
>>> _ = ax.set_ylim(-0.0625, 0.625)
>>> plt.show()
For API-level documentation, check out the Bézier Package documentation.
Development
To work on adding a feature or to run the functional tests, see the DEVELOPMENT doc for more information on how to get started.
License
bezier is made available under the Apache 2.0 License. For more
details, see the LICENSE.